
Business cycles are recurring rises and falls in overall economic activity, and they show up in output, jobs, prices, and spending. A strong phase can last 2 years or 10, while a slump can hit hard for a few quarters or drag on much longer. The common mistake students make is treating the cycle like a clock with fixed stops. That is wrong. Real cycles do not move in neat 6-month boxes, and economists often spot a recession only after GDP, payrolls, and sales data already turn down. The National Bureau of Economic Research in the US dates recessions after the fact, not in real time. Think of economic activity as the pace of buying, producing, hiring, and investing across an economy. When that pace rises, factories run more shifts, firms order more inputs, and households spend more on cars, food, travel, and services. When it falls, the opposite happens. Output slows. Hiring cools. Confidence gets shaky. This matters because business cycles affect more than headlines. They shape profits, loan demand, wage growth, and the odds that a company hires too fast or cuts too deep. If you study finance, you need to read the cycle before you price a stock, build a budget, or make a forecast.
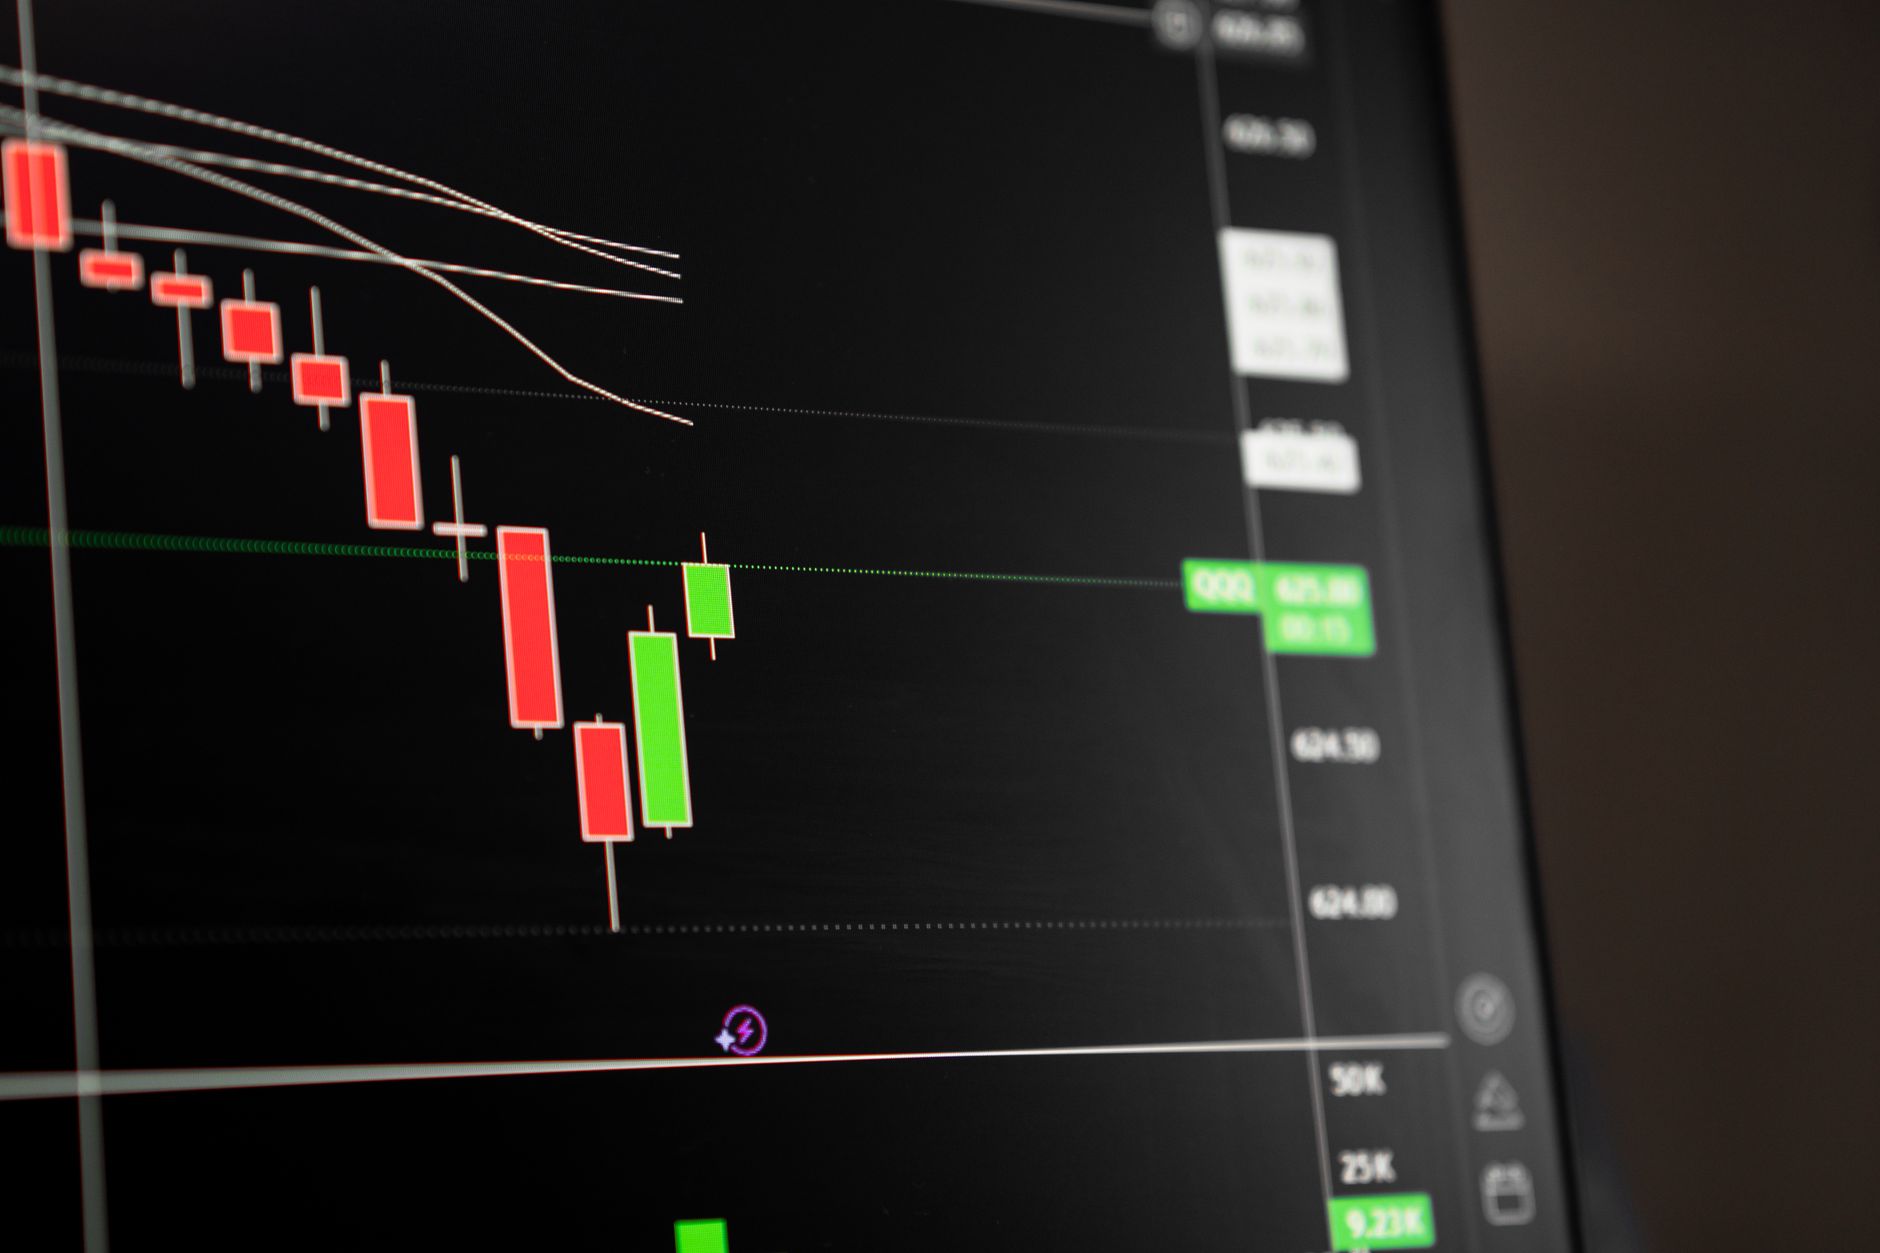
What Are Business Cycles And Economic Activity?
Business cycles are recurring swings in aggregate economic activity, not random noise, and they show up in GDP, employment, income, sales, and industrial output across 3-month and 12-month data. The cycle usually moves through growth, slowdown, contraction, and recovery, but the shape changes every time.
The most common student misconception is dead wrong: people think business cycles follow a neat timetable like a train every 6 months. They do not. One cycle can run for 18 months, another for 10 years, and the causes can mix together, from interest rates and oil shocks to war, policy changes, or a credit bust. Economists at the NBER call recessions after they study the data, which means the label often comes 5 to 12 months late.
Economic activity means the amount of real work the economy does in a period. That includes producing goods, selling services, hiring workers, and spending money on homes, equipment, and inventory. A rise in activity usually means more output and more jobs. A fall means less production, weaker hiring, and lower sales. That is the whole engine.
Reality check: A cycle is messy. It can start with 2 quarters of weak GDP, or it can show up first in layoffs, shipping delays, or a drop in restaurant sales before the headline numbers catch up.
That messiness is why smart people do not worship a single chart. They watch several signs at once, from payroll data to retail sales to manufacturing surveys, because one month can lie and three months can tell a story.
Which Phases Make Up Business Cycles?
Business cycles usually move in order through expansion, peak, recession, trough, and recovery, and each phase changes output, jobs, inflation, spending, and confidence in a different way. The labels sound simple. The real world does not.
- Expansion means real GDP rises, firms hire, and consumers spend more on cars, travel, and housing. Inflation can creep up during a long 3- to 5-year run because demand keeps pressing against supply.
- Peak is the high point. Output still looks strong, but growth starts to stall, job gains slow, and borrowing can get pricey if rates move up by 1 or 2 percentage points.
- Recession means activity contracts, sales weaken, and layoffs rise. A common rule uses 2 straight quarters of falling GDP, but the NBER can use a broader call based on income, payrolls, and production data.
- Trough is the low point. Confidence sits near the floor, spending stays soft, and firms stop cutting as fast because they have already trimmed inventories and labor.
- Recovery starts when demand turns up again. Orders improve, hiring returns, and credit use picks up, though the first 6 to 12 months can feel awkward and uneven.
The catch: The phase names sound tidy, but the movement is jagged. A market can hit peak prices in March and still show job growth through July, which is why timing matters more than labels.
People love neat diagrams. I do not trust them much. Real cycles overlap, and one part of the economy can expand while another contracts.
Learn Principles Of Finance Online for College Credit
This is one topic inside the full Principles Of Finance course on UPI Study — a self-paced, online class that earns real college credit. Credits are ACE and NCCRS evaluated and transfer to partner colleges across the US and Canada. Courses start at $250 with no deadlines and lifetime access.
Browse Principles Of Finance →How Does Economic Activity Affect Output And Jobs?
Higher demand pushes firms to produce more, and that lifts output, payrolls, and hours worked across a 1-month to 12-month window. Lower demand does the reverse. A retailer that sells 8% more than last quarter orders more stock, a factory adds shifts, and a hotel hires extra staff for weekends and holidays.
GDP rises when households, businesses, government, or foreign buyers spend more on final goods and services. Firms see the change first in orders and inventory levels. If sales beat expectations by 5% or more, managers often raise production before they raise pay. If sales miss, they cut overtime, freeze hiring, and sometimes lay off workers within 30 to 90 days.
Wages move too, but not fast. In tight labor markets, firms bid harder for workers, and pay can rise as they try to keep staff from leaving. In weak periods, wage growth slows, bonuses shrink, and new openings vanish. Unemployment then climbs because output falls faster than firms can hold labor.
What this means: Inventory changes act like a warning light. A company that carries 60 days of stock in an expansion may cut orders quickly when sales soften, and that cut hits suppliers almost at once.
This is why economists watch production, payrolls, and spending together. One number can fool you. Three numbers usually do not. That is a blunt truth, and it saves people from reading the cycle backwards.
Why Do Inflation And Spending Move With Cycles?
Inflation usually rises when demand runs ahead of supply, and that pressure often shows up after a few strong quarters, not on day one. In the US, a 3% or 4% jump in broad demand can push firms to raise prices, cut discounts, or stop absorbing higher costs. Credit also matters. When loans are easy and confidence runs hot, consumers and businesses spend faster than income growth alone would justify.
- Consumers spend more on autos, travel, dining, and home upgrades during expansions.
- Business spending rises on equipment, software, hiring, and inventory before sales arrive.
- Price hikes get easier when stores and factories run near capacity.
- Downturns bring more coupons, slower wage growth, and canceled projects.
- Confidence and credit scores can swing spending within 1 or 2 quarters.
Worth knowing: Expectations can feed the cycle. If households think prices will rise 5% next year, they often buy sooner, and that rush can heat demand even more.
Downturns work the other way. People delay big purchases, firms postpone capital spending, and banks tighten lending after losses climb. That does not mean every recession causes falling prices. It means price pressure usually cools, and weak demand gives buyers more power.
Why Do Business Cycles Matter For Finance?
Business cycles sit at the center of the principle of finance because cash flow, risk, and return all change with the economy. A company that looks solid in a 10% growth year can look shaky when sales flatten, margins get squeezed, and loan costs rise. That is why finance people watch cycles before they make forecasts, set budgets, or choose where to put money.
Forecasting depends on cycle reading. If activity is moving from expansion to slowdown, analysts usually trim revenue estimates, widen downside cases, and watch default risk more closely. If the economy shifts into recovery, they may raise sales assumptions and revisit capital spending plans. A sloppy forecast can wreck a valuation model fast, and I have seen people trust a single growth rate when they should have tested 3 scenarios.
Students in a principle of finance course need this because the cycle changes the numbers behind every decision. A business that plans to borrow, hire, or buy equipment in a 12-month window needs to know whether demand is likely to rise or fall. That is not theory for a quiz. That is money on the line.
Bottom line: Finance and the cycle move together. If you study online and earn college credit through an online course, you need work that teaches more than formulas. You need the habit of reading economic activity, because ace nccrs credit and transferable credit mean more when the course content matches real decisions, not just test answers.
A strong finance class should connect the principle of finance to planning, valuation, and risk control. If it does not, it leaves out the part students actually use.
Frequently Asked Questions about Business Cycles
You can misread recessions and booms, then pick the wrong price, hiring, or cash plan. A 2-quarter GDP drop often signals a recession, and that can hit output, jobs, and consumer spending fast.
The most common wrong assumption is that business cycles move in a neat, predictable line. They don't. Output, employment, inflation, and spending rise and fall in phases like expansion, peak, contraction, and trough.
What surprises most students is that prices can keep rising even when growth slows. That's why inflation, GDP, and jobs can point in different directions during the same quarter.
Start by tracking real GDP, unemployment, and inflation for 2 or 3 quarters. Then match each data point to expansion, peak, contraction, or trough so you can see how economic activity changes.
Most students memorize the four phases and stop there. What actually works is linking each phase to spending, hiring, and output, because businesses change plans when sales, jobs, and prices shift.
Business cycles affect output and employment because firms expand production and hire more workers in booms, then cut output and freeze hiring in slowdowns. In a recession, unemployment usually rises before spending fully recovers.
This applies to anyone studying finance, economics, or business planning. It doesn't apply only to macroeconomists; a store owner, investor, or student in a principle of finance course uses the same cycle data.
A $1 billion drop in consumer spending can pull down output, hiring, and profits in the same quarter. A $1 billion rise can do the opposite, especially in retail, travel, and manufacturing.
Business cycles and economic activity connect to a principle of finance course because forecast errors cost money. If you expect expansion, you may budget for higher sales, and if you expect contraction, you may protect cash and delay new debt.
Yes, you can earn college credit through an online course that offers ace nccrs credit and transferable credit. UPI Study credits are accepted at cooperating universities worldwide, and you can study online without sitting in a classroom for 15 weeks.
Investors care because stock prices, bond yields, and sector returns move with the cycle. Growth stocks often do better in expansions, while defensive sectors like utilities usually hold up better in slowdowns.
Inflation often climbs during strong expansions because demand rises faster than supply. It can cool during contractions, but not always fast, since prices may stay sticky for 6 to 12 months.
You should watch GDP, unemployment, inflation, consumer spending, and business investment. A 0.5% shift in quarterly GDP or a 0.3 point move in unemployment can signal a change before headlines do.
Final Thoughts on Business Cycles
Business cycles are not a neat school diagram. They are the real rhythm of the economy, and they push output, jobs, inflation, spending, and confidence in uneven waves. Remember this: the cycle changes before the headlines do, and the data usually confirms it later. That lag matters. Firms that hire too fast at the top often face layoffs later. Investors who buy after every hot month can overpay. Managers who ignore a slowdown can sit on too much inventory and too many costs. The smart move is not to guess a perfect turning point. The smart move is to watch the signs early and plan for 3 paths, not 1. This idea also sits right inside finance. Valuation, budgeting, lending, and capital spending all depend on what demand does next, not what it did last year. That is why cycle reading belongs in any serious finance toolkit. It helps you avoid bad bets, set tighter forecasts, and make cleaner decisions when conditions turn rough. Use the cycle like a warning system, not a horoscope. Track GDP, payrolls, sales, and inflation together, then adjust your plan before the market forces your hand.
How UPI Study credits actually work
Ready to Earn College Credit?
ACE & NCCRS approved · Self-paced · Transfer to colleges · $250/course or $99/month