
Pandas is a Python library for data analysis and data manipulation, and it sits right at the center of tabular work like CSV files, spreadsheets, and database exports. If you have rows, columns, labels, or messy missing values, Pandas gives you faster tools than plain lists and dictionaries. That is why students and working programmers reach for it so often. A sales sheet with 10,000 rows, a survey file with 27 columns, or a log export with blank cells all become easier to clean and study once Pandas steps in. Python can handle those jobs without it, but the code gets clunky fast. Pandas also fits the way people learn programming in python course settings and in self-paced online course study online paths. You load data, inspect it, clean it, group it, and then export results. That workflow matters because real data rarely arrives neat. Dates come in odd formats. Values go missing. Column names sometimes look like a typo fight. The short version: if someone asks what is the pandas library in python for data analysis, the answer is that it gives Python a practical, table-friendly way to work with real data instead of toy examples. It helps you move from raw files to answers without writing 200 lines of custom code. That is the reason Pandas feels less like a side tool and more like the default first stop for data work in Python.
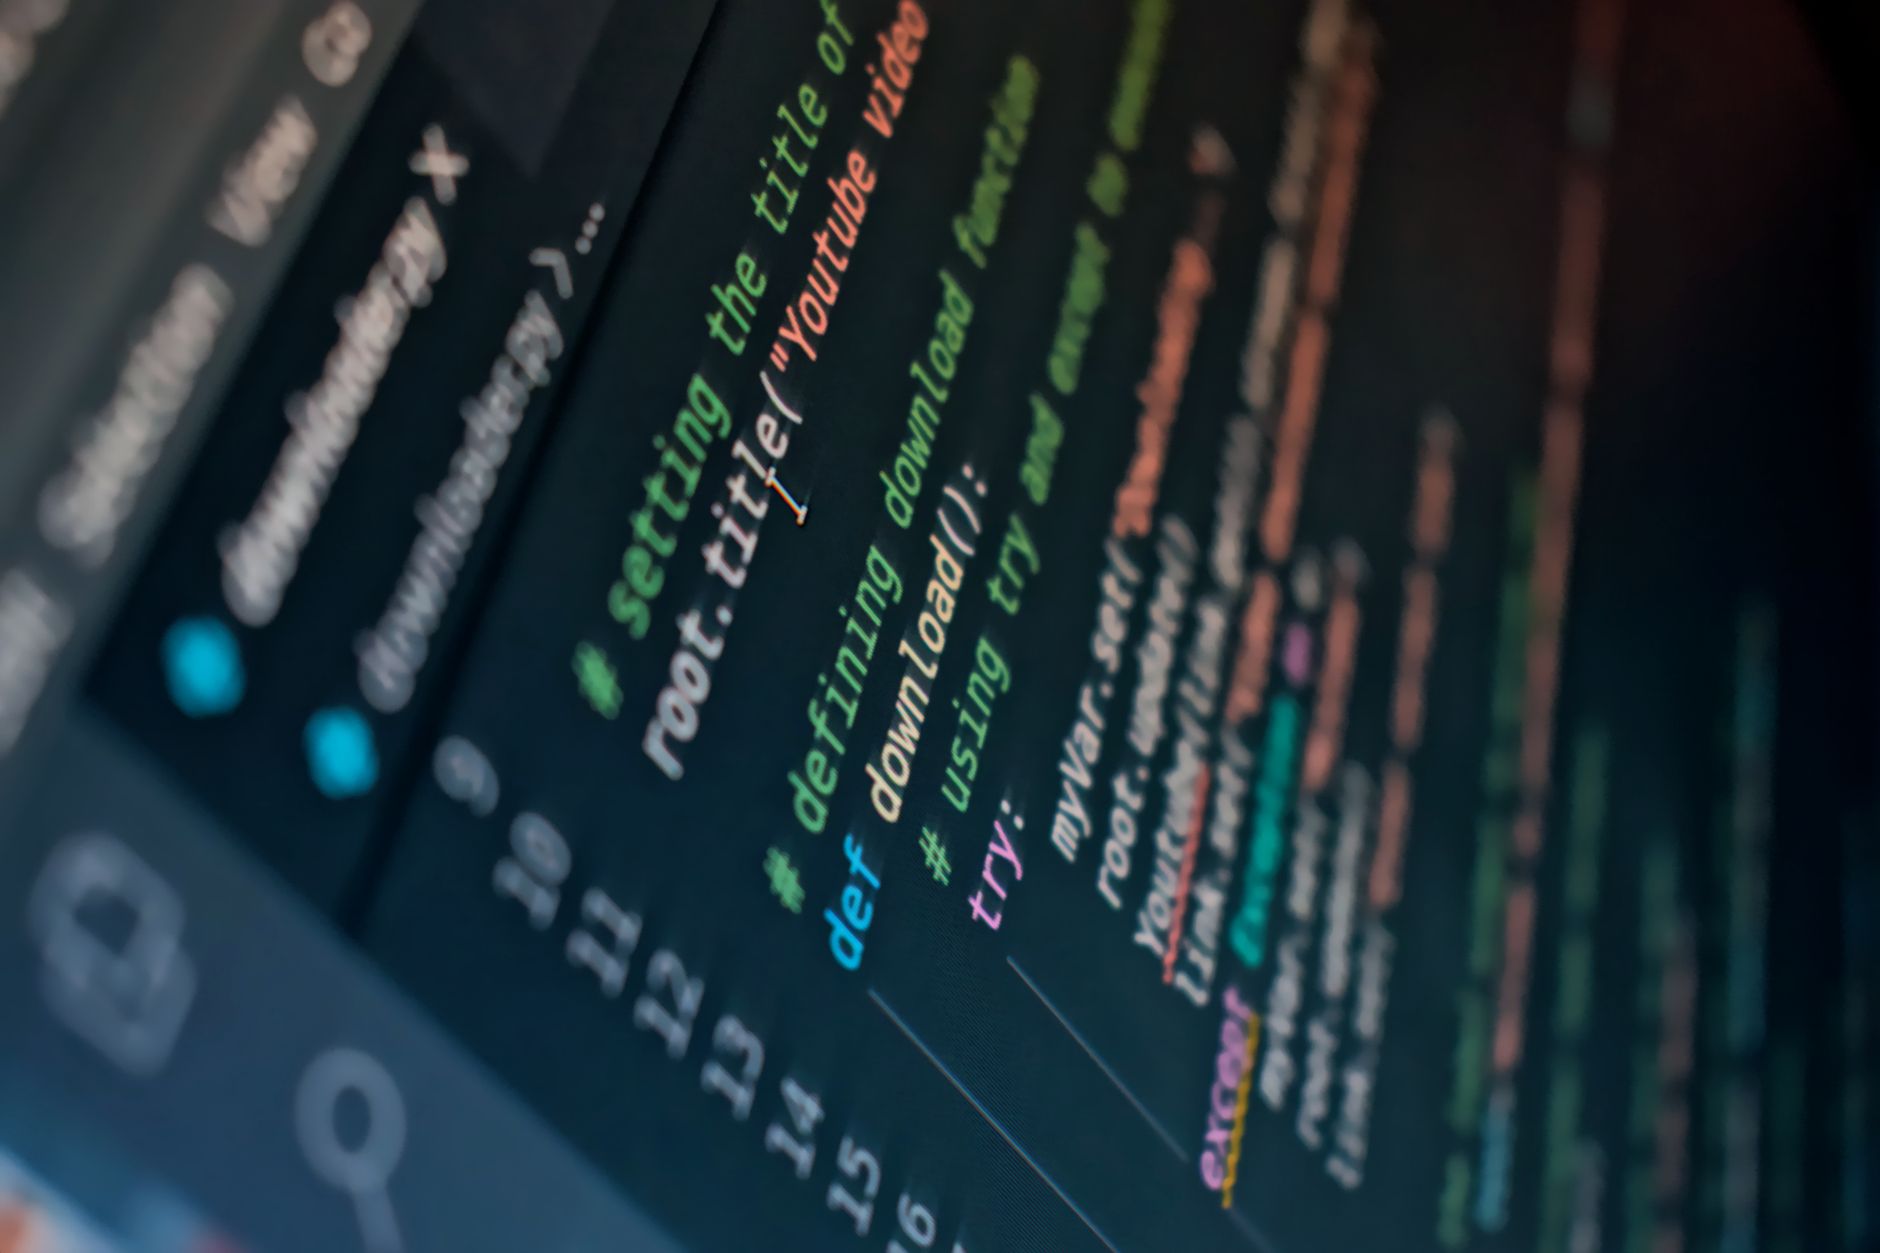
What Is The Pandas Library In Python?
Pandas is a Python library built for data analysis and data manipulation, especially when your data comes in rows and columns instead of one long list. It gives you higher-level tools for cleaning, reshaping, sorting, and exploring data than plain Python lists and dictionaries, which matters once a file hits 1,000 rows or more.
A lot of people meet Pandas after they have already used basic programming in Python and feel the pain of manual work. A list can hold values, and a dictionary can map names to values, but neither one feels made for a 12-column CSV file with missing entries and repeated categories. Pandas was built for that exact kind of job. I like that it treats data like a working table, not a puzzle.
The library showed up in 2008 and quickly became the default choice for tabular analysis in Python. That did not happen by accident. It gave programmers one clear place to read files, rename columns, filter rows, and combine datasets without building each step from scratch. A student in a programming in python course can see the difference right away when the code moves from dozens of lines to a few clean calls.
The catch: Pandas works best with structured data, so it feels less natural for raw text, images, or unshaped JSON until you convert that material into a table first.
A solid introduction to the pandas library for data analysis starts with that idea: Pandas is not a general Python replacement, it is a table-first tool. If your data looks like a spreadsheet from Excel, Google Sheets, a lab export, or a sales report, Pandas gives you a faster route from file to answer. The real payoff comes from speed, not showiness.
You also see why people mention college credit and transferable credit in this space, because data tasks often show up in courses that count toward a degree or certificate. A learner who studies online can practice the same file-cleaning steps used in real jobs, and that makes the work feel concrete instead of decorative.
Why Do Python Programmers Use Pandas?
Python programmers use Pandas because it saves time on the most annoying parts of analysis: missing values, filters, sorting, grouping, and joins. A task that might take 40 lines with the standard library often takes 5 to 10 lines in Pandas, and that difference matters when you repeat the same analysis across 3 or 4 files.
Pandas also gives you a clean way to think. You do not have to keep rebuilding the wheel every time you want to count sales by region or remove blank rows. You can read a file, check the shape, and start asking questions almost right away. That makes it a favorite in programming in python course work, especially when the goal is to finish a small analysis inside 1 week instead of getting stuck on syntax.
Reality check: Pandas does not make bad data good, and it will happily show you every messy column name and every broken date field you ignored.
Students in an online course often meet Pandas in assignments that mimic job tasks: clean a CSV, compare 2 columns, group records by category, and export a tidy result. That is why it fits study online so well. The same tool supports practice, projects, and assessment, which gives the work a real shape. When a course builds toward ace nccrs credit, that kind of practical output feels a lot stronger than a quiz on definitions alone.
Pandas also helps with transfer-style learning outcomes because the skills travel. A student who learns to filter rows, use missing-value rules, and join tables can apply those same steps in finance, health data, marketing, or research. The tool does not care about the subject. It only cares that the data has columns and labels. That simple focus is its biggest strength, and honestly, it beats flashy tools that look nice but slow you down.
For a deeper practice set, the Programming in Python course gives learners a place to pair syntax with real dataset work. The value shows up fast when you compare a clean Pandas pipeline with a manual spreadsheet routine that eats 30 minutes every time.
How Do Series And DataFrames Work?
Series and DataFrame are the two core Pandas structures, and they explain almost everything people do with the library. A Series holds one column of labeled data, while a DataFrame holds two-dimensional table data with rows and columns, so most students spend 90% of their time inside DataFrames.
A Series acts like a one-dimensional list with labels attached. Those labels form an index, which helps you point to values by name instead of only by position. If you store monthly sales for 12 months, the index might use January through December. That label layer sounds small, but it saves real time when you compare values or line up records from 2 different sources. I think that label system is one of Pandas’ smartest ideas.
A DataFrame works like a sheet where each column can hold a different type of data. One column can store names, another can store dates, and a third can store numbers like 150 or 2.75. Rows hold records, columns hold variables, and the index gives each row a name or number. In an introduction to the pandas library for data analysis, this is the object students learn first because it matches how most real data arrives.
What this means: A DataFrame lets you use one set of tools on a 5-column class roster or a 50-column research export without changing your whole approach.
The main trick is that Pandas keeps the table shape visible all the time. You can grab one column as a Series, compare it with another Series, or select a slice of rows from the DataFrame. That makes analysis feel direct instead of tangled. A student working through a Programming in Python module often notices this the first time they filter a table and see the result shrink from 1,200 rows to 84.
A downside shows up too. Once a DataFrame gets very wide or very large, you need some care with memory and speed, because Pandas runs in memory on your machine. That means a laptop with 8 GB RAM can choke on heavy files faster than a database would.
For data analysis, though, the pairing of Series and DataFrame stays hard to beat. The structure feels simple, and that simplicity hides a lot of power.
Learn Programming In Python Online for College Credit
This is one topic inside the full Programming In Python course on UPI Study — a self-paced, online class that earns real college credit. Credits are ACE and NCCRS evaluated and transfer to partner colleges across the US and Canada. Courses start at $250 with no deadlines and lifetime access.
Browse Programming In Python →Which Pandas Tasks Matter Most For Analysis?
Most Pandas work starts with a file and ends with a cleaner table. A CSV with 500 rows can become a tidy DataFrame in one line, and that one move sets up filtering, grouping, and export work that would take much longer by hand.
- Use
read_csvto load CSV files into a DataFrame. That is the first move in most Python data analysis workflows, and it handles files with 10 rows or 100,000 rows the same way. - Select columns by name to cut noise fast. If a file has 20 columns but you only need 4, Pandas lets you isolate them in one step.
- Filter rows with conditions like age > 18 or status == "active". This is where Pandas starts to feel much faster than sorting through a spreadsheet by eye.
- Clean missing values with
dropnaorfillna. Those two methods matter because blank cells show up in almost every real dataset, from survey exports to bank records. - Group data by a category column and aggregate with counts, sums, or averages. A sales table can turn into region totals in under 10 seconds once the data is set up right.
- Merge datasets when one file holds IDs and another file holds names or scores. This is one of the places Pandas saves a huge amount of manual matching work.
- Use basic plotting support for quick charts like bar graphs or line charts. The chart tools stay simple, but they help you spot patterns before you spend 30 minutes overthinking the table.
Bottom line: A student who can read, clean, group, and merge data already knows the core of practical Pandas work.
The Programming in Python path fits this kind of practice well because the assignments can use real tables instead of fake toy examples.
How Does Pandas Fit Into A Python Workflow?
A clean Pandas workflow usually follows 5 steps: import the library, load the file, inspect the first 5 rows with head(), clean missing values, then analyze and export the result. That pattern matters because it keeps you from guessing. If a dataset has 2,000 rows and 14 columns, you want to see the shape before you start grouping or filtering, not after you have built the wrong chart.
- Import Pandas as
pdand keep the code short. - Load the file with
read_csvor a similar reader. - Check the first 5 rows with
head()before any edits. - Look for blank cells, odd dates, or duplicate rows.
- Save the cleaned result to CSV or Excel.
Worth knowing: The first 5 rows often reveal bad headers, mixed data types, and hidden blanks before they wreck the rest of the analysis.
Students who practice this sequence in a programming in python course build habits that travel well to analytics work, lab reports, and office data tasks. That is one reason Programming in Python shows up so often in skill plans. The workflow also pairs nicely with a second course like Database Fundamentals when learners need to understand where tables come from and how they move between systems.
Pandas fits because it keeps the process simple: inspect, clean, analyze, export. If you skip inspection, you invite bad results. If you skip cleaning, your averages lie. That bluntness is part of the appeal.
How UPI Study Fits This Topic
90+ college-level courses, 2 approval bodies, and 1 self-paced format make the setup feel unusually practical for data study. UPI Study offers ACE and NCCRS approved courses, and that matters because US and Canadian colleges already use those bodies when they review non-traditional credit.
UPI Study fits a Pandas learning path because students can study online, move at their own pace, and build real coding habits without a fixed calendar. The pricing is simple too: $250 per course or $99 per month for unlimited access. No deadlines. That removes the usual time pressure that makes a 6-week module feel rushed.
The Programming in Python course works well here because Pandas is not a theory-only topic. You need repetition with tables, missing values, indexes, and grouped results before the code starts to feel normal. UPI Study also offers 90+ college-level courses, so a learner can pair Python with other subjects in one place instead of scattering progress across sites.
UPI Study credits transfer to partner US and Canadian colleges, which gives the work a real academic path instead of leaving it as informal practice. That setup helps students who want ace nccrs credit, transferable credit, or just a clear course record they can use later. The mix feels practical, not flashy. I like that. It keeps the focus on skills first and paperwork second.
Final Thoughts
Pandas gives Python a table-first way to handle real data, and that changes the whole feel of analysis. A task that looks messy in plain Python often turns into a short sequence of reads, filters, groupings, and exports once you use DataFrame logic instead of raw loops. That is why so many students meet it early and keep using it later.
The real value sits in the small things. Series helps you work with one labeled column. DataFrame helps you work with whole tables. Missing values stop being a disaster. CSV files stop feeling like a chore. Even the first 5 rows can tell you a lot if you know where to look.
Pandas also teaches a useful habit: inspect before you act. That habit saves time in data cleaning, reporting, and class projects, and it protects you from the kind of mistake that ruins a nice-looking chart. A good analysis workflow does not need drama. It needs clear steps and a tool that handles the boring parts well.
If you are learning Python for data work, start with a small CSV file, one missing-value rule, and one grouped summary. Then build from there. The code will feel less strange after just a few rounds, and the results will start to make sense faster than you expect.
Frequently Asked Questions about Pandas
Start with a DataFrame, because Pandas handles rows and columns like a spreadsheet and lets you clean, filter, sort, and group data in Python. You can also use a Series for one column, which makes quick analysis on text, dates, and numbers much easier.
This helps you if you work with tables, CSV files, Excel sheets, or survey data in programming in Python; it doesn't help much if you only write small scripts that print text or handle one value at a time. A biology student, a sales analyst, and a programmer in a programming in Python course all use it for different data tasks.
If you confuse a Series with a DataFrame, you can pick the wrong method, get shape errors, and waste time fixing code that should have worked in 1 line. That mistake shows up fast when you try to slice 1,000 rows or merge 2 files.
What surprises most students is that Pandas isn't just for data scientists; it also helps you read 10,000-row CSV files, fix missing cells, and join tables in a few lines. The library wraps NumPy, but it adds labels, indexes, and table-style tools that feel closer to Excel.
The most common wrong assumption is that Pandas only stores data, but it also changes data with filters, joins, pivot tables, and date tools. You can use it to drop duplicates, rename columns, or group sales by month in the same workflow.
Pandas can save you 20 to 30 manual steps when you clean a medium CSV, because one filter or groupby line can replace a pile of spreadsheet clicks. That matters when you study online or take an online course with weekly data labs.
Most students open a file and jump straight into plotting, but what actually works better is loading the data, checking column names, fixing missing values, and only then analyzing it. That order keeps errors low and makes your results easier to trust.
Yes, for many class projects and quick reports, Pandas gives you the main tools for tabular analysis in Python. You still pair it with NumPy for math and Matplotlib or Seaborn for charts when you want visual output.
Yes, a programming in Python course that uses Pandas can support college credit work because you learn the same table skills used in ACE NCCRS credit classes and other transferable credit pathways. You also practice reading CSV files, cleaning data, and writing short analysis notebooks.
Pandas sits between raw files and final answers: you load data, clean it, inspect it, analyze it, and then export results as CSV or Excel. That workflow works well for 1 file or 50 files, and it keeps your analysis in code instead of scattered clicks.
Final Thoughts on Pandas
How UPI Study credits actually work
Ready to Earn College Credit?
ACE & NCCRS approved · Self-paced · Transfer to colleges · $250/course or $99/month