
The signed area under a curve in calculus means you add the parts above the x-axis and subtract the parts below it, so the answer gives net change, not raw space. That idea sits right inside a definite integral, which turns a graph into a running total over an interval like 0 to 5 or 2 to 8. This matters in calculus 1 because a graph can rise, fall, cross the axis, and still tell one clean story. If a velocity graph sits above zero for 3 hours and below zero for 2 hours, the signed area tells you the net motion, not just the total shape on the page. Students trip here fast because they see “area” and think only of positive space. That sounds reasonable, but it misses the sign. A region below the x-axis has negative y-values, so it subtracts from the total. That is why the area under a curve concept signed area uses direction, not just size. You can think of it as accumulation with a sign attached. Revenue, distance, fluid flow, and charge all use this idea in different ways, and the same integral can show gain, loss, or no net change over 1 interval. Once that clicks, the graph stops looking like art and starts looking like a record of change.
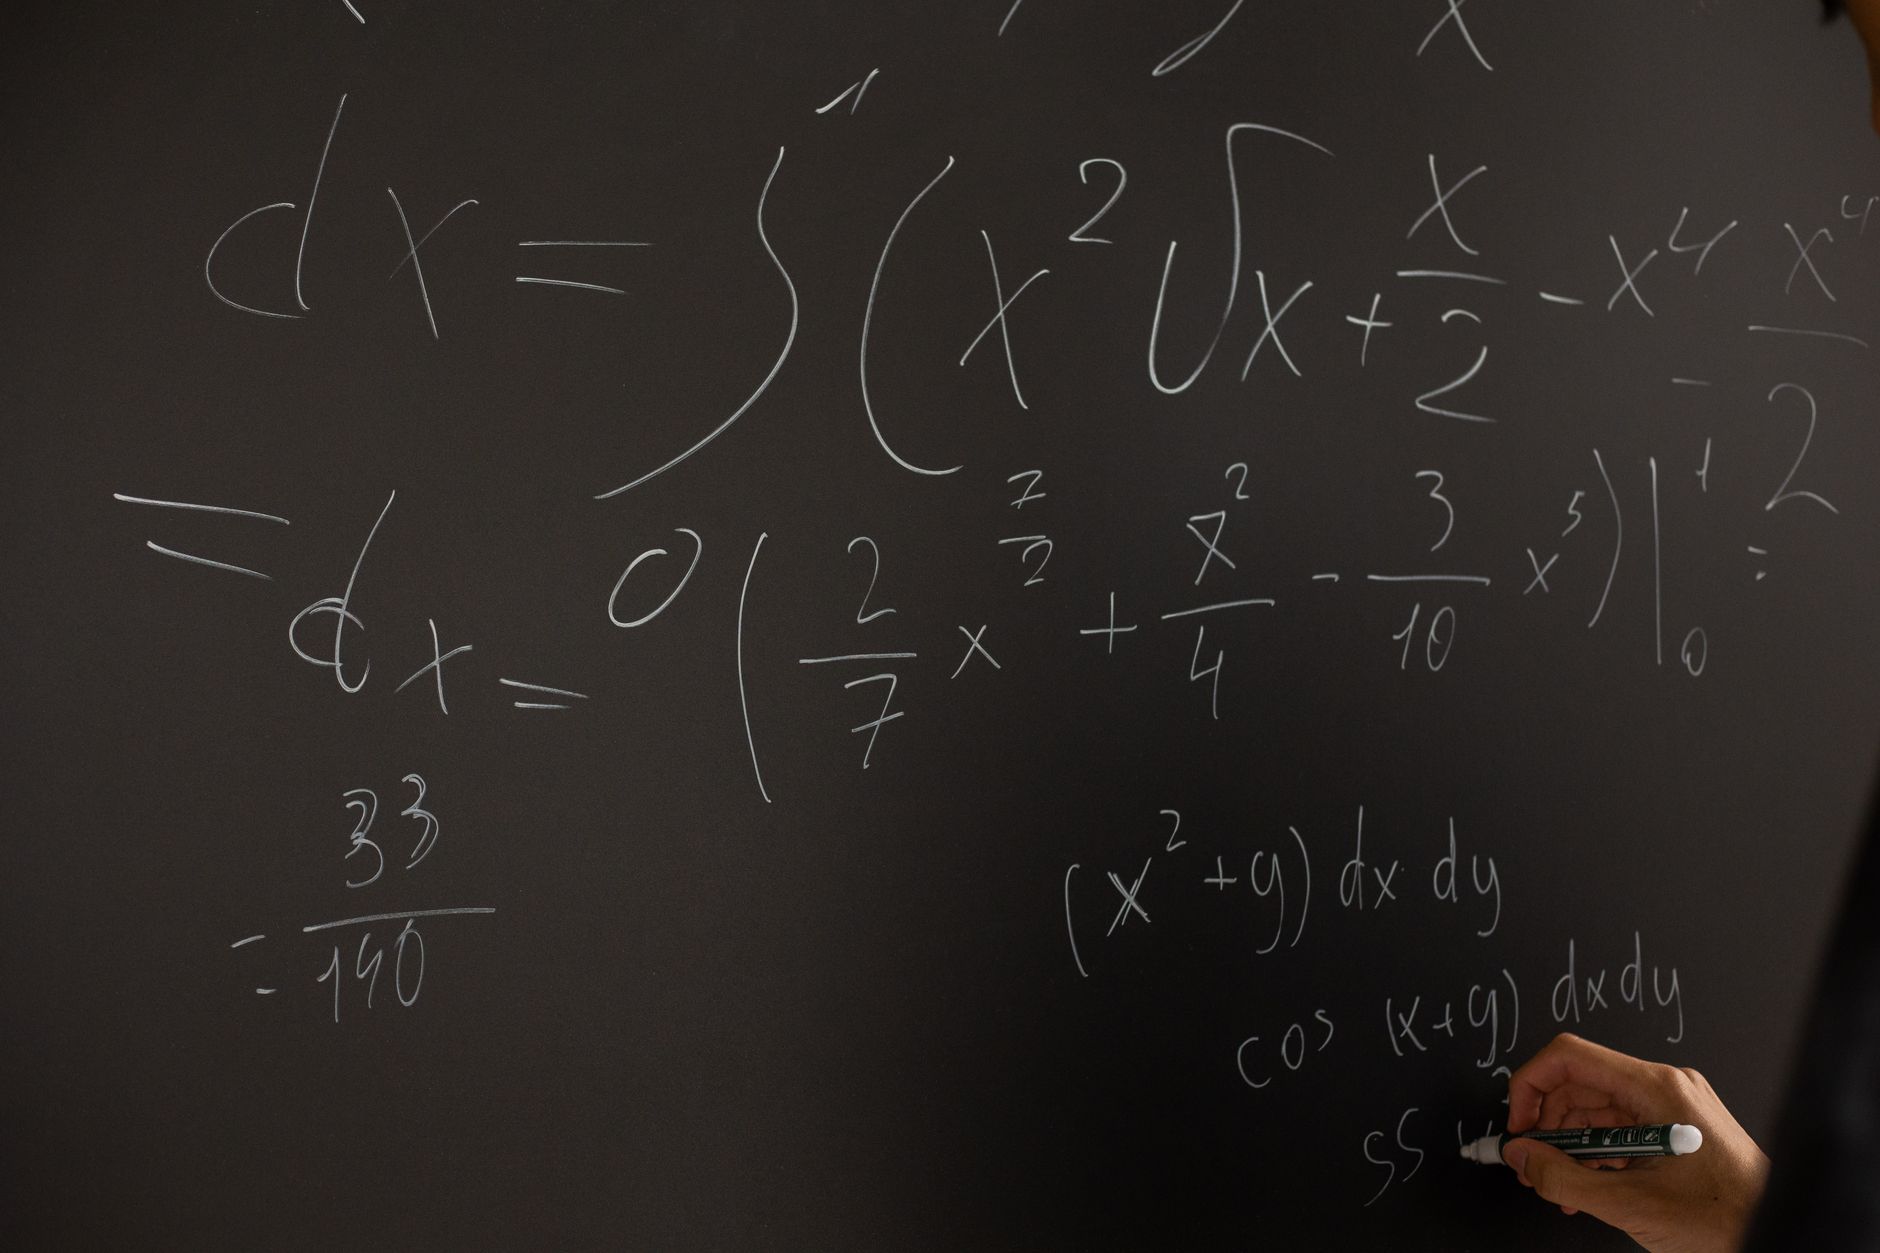
What Does Signed Area Under A Curve Mean?
Signed area under a curve means you total the area above the x-axis as positive and the area below it as negative, so the final number shows net result, not just shape. In calculus 1, that is the meaning behind a definite integral from 0 to 4, or from 1.5 to 6.
The catch: a curve can look large on the page and still give a small answer if 8 square units sit above zero and 7 sit below it. That is not a mistake; that is the point. The integral tracks direction, so the sign matters as much as the size.
A lot of students first meet this idea in a calculus 1 course through graphs of velocity, where positive values mean forward motion and negative values mean backward motion. If you travel 10 miles forward in 2 hours and then 4 miles back in 1 hour, the net change is 6 miles forward. Signed area works the same way.
The phrase areas and accumulation rea under a curve concept signed area sounds clunky, but the idea itself is clean: each thin slice adds or subtracts from a total across the interval. A definite integral does that slice by slice, often from x = 0 to x = 3 or x = 2 to x = 9.
That is why I like signed area better than plain area for calculus work. Plain area ignores the graph’s sign and loses the story. Signed area keeps the story intact.
Why Do Areas Below The X-Axis Count Negative?
Areas below the x-axis count negative because the y-values are below 0, so they represent subtraction in the total instead of addition. If a graph stays at y = -3 for 2 units of x, the signed area is -6 square units, not +6.
That rule comes from algebra and geometry working together. On the graph, every rectangle or slice has a height measured from the x-axis, and if that height is negative, the slice contributes a negative amount. The definite integral respects that sign, which is why it gives orientation, not just size.
Reality check: many students want to flip the sign and call every shaded region “area,” but that breaks the meaning of the graph in 1 very specific way. If a velocity graph is below zero for 4 seconds, the object moves backward or loses position, so the negative sign matters. Remove it, and you lose the net change.
I think this is one of the smartest parts of calculus. The graph does not just tell you how much happened; it tells you which way it happened. A 5-unit block above the axis and a 5-unit block below the axis do not mean the same thing.
If you study online and want a cleaner picture, a graph that crosses the axis at x = 2 and x = 7 is a good test case. The sign of each region tells you how the total builds across those 2 crossings.
How Do You Compute Signed Area With Definite Integrals?
A signed area problem gets easier when you treat it like a 5-step checklist. Find the interval first, then break the graph at every x-intercept, because the sign can change fast at x = 1, x = 3, or x = 6.
- Start with the interval. If the problem asks for signed area on [0, 4], you only work inside those 4 x-values.
- Find where the curve crosses the x-axis. Those crossings split the problem, and a graph that crosses at x = 2.5 needs separate pieces on each side.
- Write one integral for each piece. If the curve sits above the axis from 0 to 2 and below it from 2 to 4, set up two definite integrals, not one mixed mess.
- Compute each part. For a simple example, suppose the positive region has area 8 square units and the negative region has area 3 square units; the signed area is 8 - 3 = 5.
- Check the sign of the final answer. A result of -2 means the below-axis area outweighed the above-axis area by 2 square units.
- Interpret the number in context. If the graph showed velocity over 6 seconds, a signed area of 5 means 5 units of net displacement, not 5 units of total travel.
What this means: the integral does not care how dramatic the curve looks; it cares how much positive and negative contribution the interval produces. That is why the process works on a smooth parabola or a jagged graph with 3 crossings.
If you want a clean practice problem, use this Calculus I course as a study source and check whether your answer changes when the graph drops below zero. That one habit saves a lot of points on exams.
Learn Calculus 1 Online for College Credit
This is one topic inside the full Calculus 1 course on UPI Study — a self-paced, online class that earns real college credit. Credits are ACE and NCCRS evaluated and transfer to partner colleges across the US and Canada. Courses start at $250 with no deadlines and lifetime access.
Browse Calculus 1 Course →How Is Signed Area Related To Accumulation?
Signed area models accumulation because a definite integral adds tiny contributions across time, distance, or any other changing quantity, then gives one net total. If a rate stays positive for 3 hours and negative for 2 hours, the integral reports the balance across all 5 hours.
That is why calculus shows up in motion, flow, and money. A velocity graph gives net displacement in meters, a flow-rate graph gives net volume in liters, and a profit-rate graph gives net gain in dollars over a 1-day or 1-month span. The same math works because the integral keeps track of sign.
Worth knowing: accumulation feels abstract until you tie it to a real unit like 12 liters, 40 miles, or $100. Then the graph stops being a picture and starts acting like a ledger. I think that shift is the real payoff of calculus 1.
A definite integral is basically a machine that keeps adding small signed pieces, one after another, across the interval. That is why a curve above the axis for 6 units and below it for 4 units can still end near zero. The total does not care about raw shading; it cares about net effect.
This idea also explains why two graphs with the same absolute area can tell different stories. One can mean +9 units of change, and the other can mean -9 units of change. Same size, opposite meaning.
What Common Mistakes Confuse Signed Area?
Most mistakes come from treating signed area like plain area. That error shows up fast on a graph with 2 crossings, because the sign flips and the total changes in a way many students do not expect.
- Do not use absolute area unless the problem says “total area.” Signed area keeps the plus and minus signs from the graph.
- Split at every x-intercept, even if the curve crosses at x = 1 and x = 4. One integral can hide a sign change.
- Do not mix area with net change. A velocity graph over 6 seconds gives displacement, not total distance.
- Watch the axis, not just the shading. A region below y = 0 subtracts from the total, even if it looks large.
- Check the units before you answer. Square units work for geometric area, while meters, liters, or dollars often signal accumulation.
- If you study in an online course, redraw the graph and mark positive and negative parts with + and - before you compute. That 30-second step catches a lot of errors.
Calculus I practice problems usually expose these mistakes within 1 or 2 tries, which is annoying but useful. I like that kind of pressure because it forces the idea to stick.
One more trap: students sometimes assume every negative y-value means “bad” in a real-life story. Not true. In a rate graph, negative can just mean reverse direction, loss, or decrease.
How Can You Practice Signed Area In A Calculus 1 Course?
Practice signed area by drawing 3 simple graphs, marking each x-intercept, and computing the net result on intervals like [0, 2], [2, 5], and [5, 8]. A curve that rises, falls, and crosses zero twice gives you the best training because the sign changes at least 2 times.
Start with easy numbers. Use a constant region of +4 for 2 units, then a constant region of -3 for 1 unit, then ask what the signed area equals. You should get 8 - 3 = 5, which makes the sign logic obvious.
Then move to a smoother graph and write the integral in pieces. That habit matters in a calculus 1 course because many exam problems hide the crossing points instead of labeling them for you. If you miss one crossing, your answer can miss by 100% or more.
The best practice is to say the meaning out loud: “This part adds, this part subtracts, and the final number gives net change.” That sentence sounds simple, but it stops a lot of careless work.
If you want more structure, set a 30-minute study block and solve 4 signed-area problems in a row. Repetition like that beats random guessing, and the sign convention starts to feel natural instead of strange.
Frequently Asked Questions about Signed Area
Signed area under a curve in calculus is the net area between a graph and the x-axis, and definite integrals add the parts above the axis as positive while counting parts below it as negative. That’s why the answer can be 0 even when the graph has visible area.
If you get a negative result, the graph spent more of the interval below the x-axis than above it, so the integral showed net change below zero. A common case is a function like y = -2 over 3 units, which gives -6.
The most common wrong assumption is that all area must be positive, but calculus 1 treats area above the x-axis as positive and area below it as negative. That means a shape can look large and still cancel out part of another region.
Start by finding where the curve crosses the x-axis, because those points split the interval into positive and negative pieces. Then you set up separate definite integrals, like from 0 to 2 and from 2 to 5, instead of mixing everything together.
If you ignore the sign, you get the wrong net change, and that can wreck answers in physics, economics, and calculus 1 course problems. A tank-fill problem or velocity problem can look right by area size alone and still give the wrong final amount.
Most students try to memorize a picture, but what actually works is to split the interval at every x-intercept and compute each definite integral with its sign. That method works in both an online course and a regular college credit class.
What surprises most students is that the signed area can equal the net change, not the total space under the graph. In a velocity graph, 8 units above the axis and 8 units below it can give 0 net displacement.
This applies to anyone taking calculus 1, a calculus 1 course, or an online course that counts for college credit, including ace nccrs credit and transferable credit programs. It doesn’t change just because you study online; the same sign rules still apply.
Signed area shows accumulation because a definite integral adds up small pieces over an interval, usually using 50, 100, or more tiny slices in the limit. If the slices sit above the x-axis, they add to the total; if they sit below, they subtract from it.
Area under a curve in calculus 1 means the total accumulated amount between the graph and the x-axis over a set interval, found with a definite integral. If the graph crosses the axis, you separate the interval and keep track of positive and negative parts.
You treat any region above the x-axis as positive and any region below it as negative, no matter how large the shape looks on paper. A curve from x = 1 to x = 4 can add 12 square units above the axis and subtract 5 units below it.
Teachers link signed area to net change because a definite integral measures how much a quantity increases or decreases over an interval, like 3 to 7 or 0 to 10. If you read a velocity graph, the integral gives displacement, not total distance.
Yes, signed area shows up in calculus 1 topics that appear in online course work tied to ace nccrs credit and transferable credit paths, so you need the sign rule from the start. If you miss that rule, your answers can be off even when your setup looks neat.
Final Thoughts on Signed Area
Signed area gives calculus its real voice. A graph does not just show shape; it shows how much one part adds and how much another part takes away. That is why a definite integral can tell you net displacement, net flow, or net gain across 1 interval without turning the whole problem into guesswork. If you remember only one thing, remember this: above the x-axis means positive contribution, below it means negative contribution, and the final answer tells the balance. That balance can be 0, 7, -12, or any other number, but the sign always carries meaning. Miss the sign, and you miss the story. The cleanest way to study this topic is to sketch the graph, mark every x-intercept, and say what each region does before you calculate. That habit keeps you from confusing geometric area with signed area, and it makes the definite integral feel less mysterious. A lot of students get stuck because they think calculus only wants formulas. It does not. It wants interpretation. The formula gives the number, but the sign gives the meaning. Take one graph, one interval, and one integral, then work it slowly until the sign makes sense.
The way this actually clicks
Skip step 3 and the whole thing is wasted.
Ready to Earn College Credit?
ACE & NCCRS approved · Self-paced · Transfer to colleges · $250/course or $99/month