
GUIs in system analysis and design are the interactive screens people use to get work done, and they shape how fast, clear, and error-free a system feels. A GUI is not decoration. It is the bridge between user needs and the software’s rules, data, and actions. This matters because people judge a system in about 5 seconds, not after a 40-page spec. If a login page, dashboard, or form feels clumsy, users blame the whole system, even if the back end works fine. Good GUI work starts during analysis, where teams sort out tasks, inputs, outputs, and limits before anyone starts polishing colors or icons. The common student mistake is thinking the GUI starts after the “real” design work ends. That flips the process. In practice, the screen design tells you a lot about the process design, the data model, and the error handling. A checkout form, for example, exposes whether the system needs one address field or three, whether a user can save progress, and whether a failed payment needs a retry button or a support link. Once you see GUIs that way, system analysis and design gets more concrete. You stop asking, “What should the page look like?” and start asking, “What must this person do in 30 seconds, and what screen layout helps them do it with fewer mistakes?”
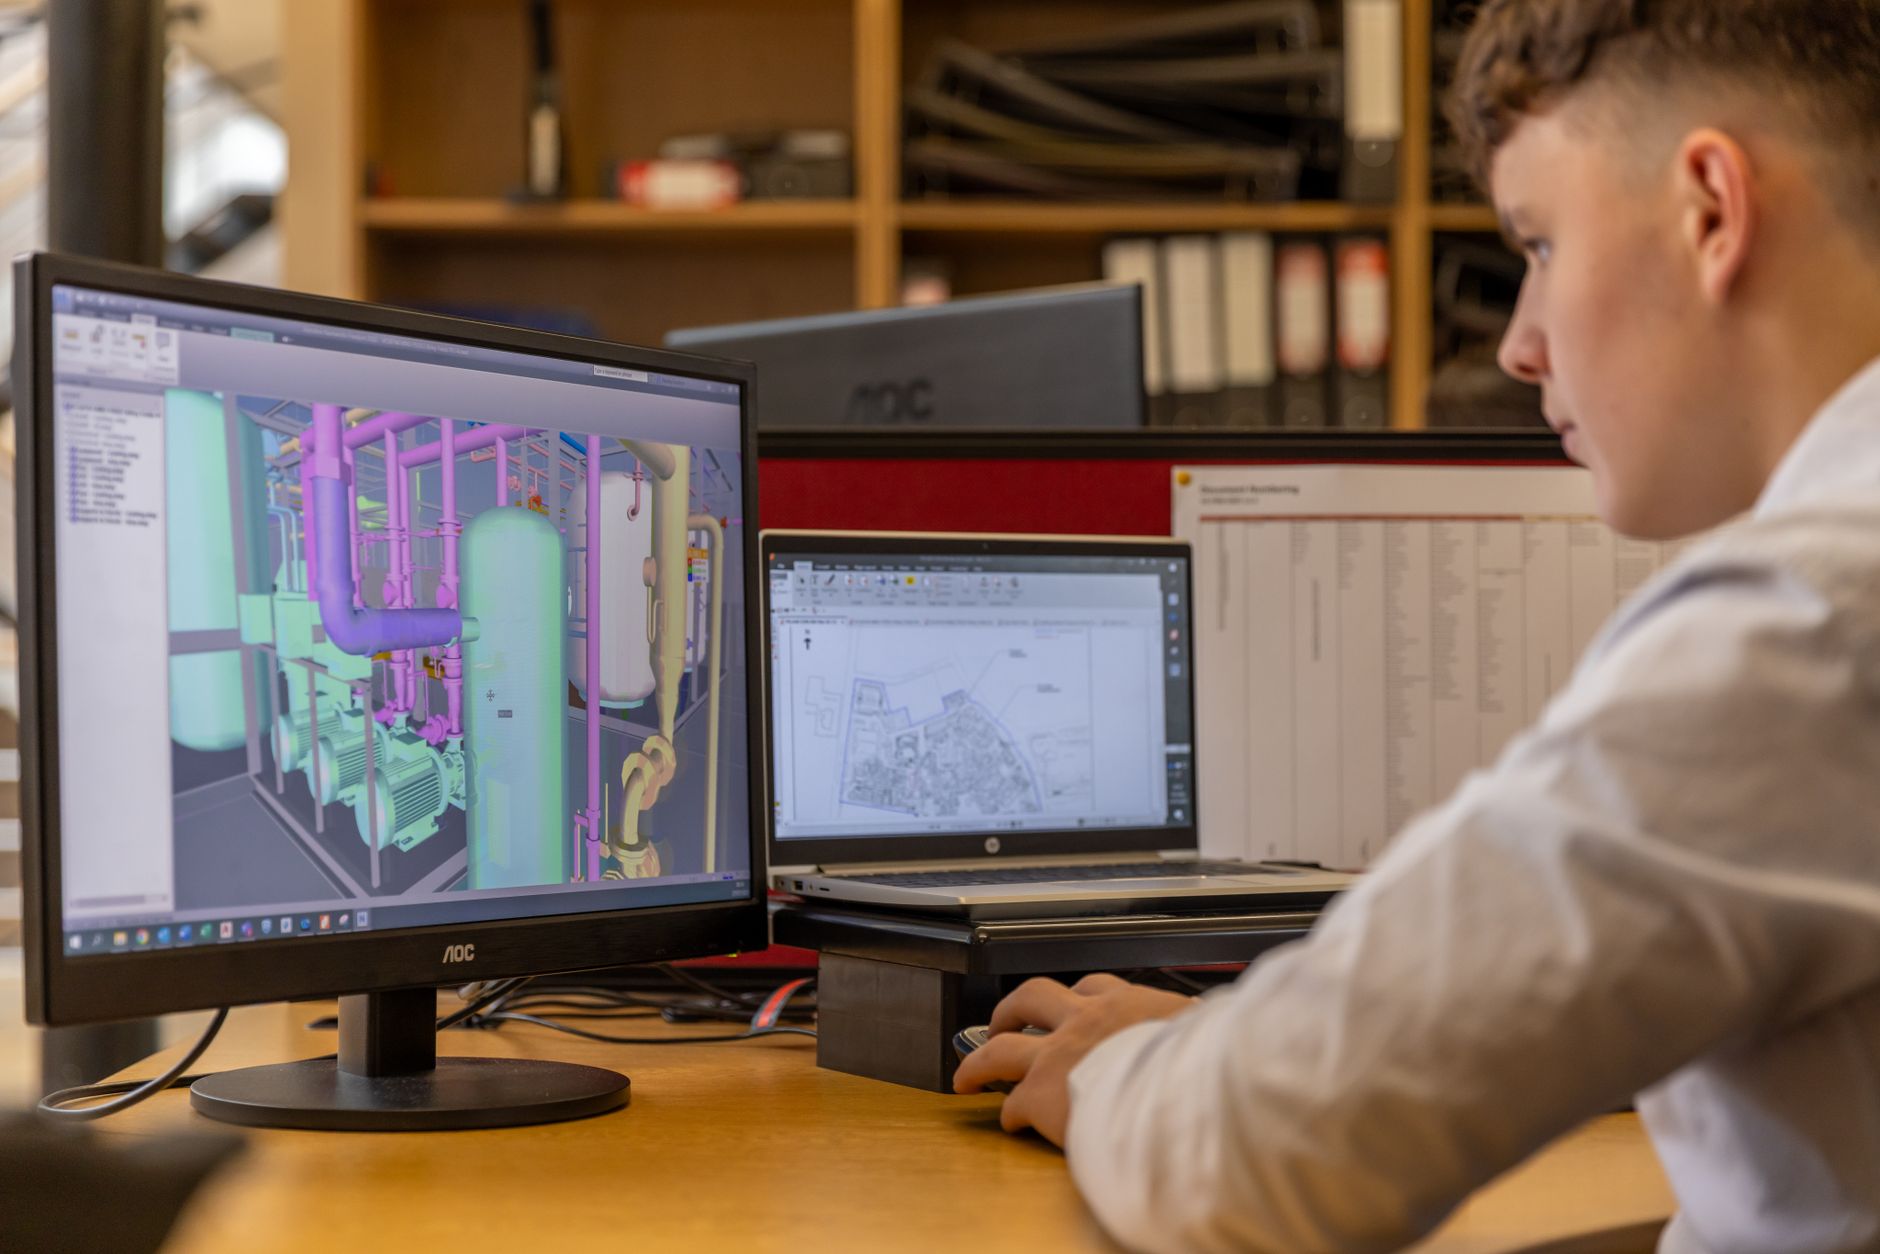
What Are GUIs in System Analysis?
A GUI in system analysis is the part of the system that turns a user task into clicks, fields, menus, and feedback, and teams usually sketch that layer before the first build sprint starts. That means the GUI links business rules, user goals, and technical limits in one visible place.
The catch: Most students call the GUI the “pretty screen,” but that idea misses the whole job. A screen with 12 buttons and 6 labels can still fail if it hides the 3 main tasks, makes users guess, or forces 4 extra steps. In analysis, the GUI acts like a map of behavior, not a paint job.
Think about a hospital intake screen, a banking app, or a university registration form. Each one needs more than style. It needs the right fields, the right order, and the right response when a user types the wrong date, picks the wrong course code, or leaves a required box blank.
That is why analysts ask about frequency, risk, and task length during requirements work. If 80% of users repeat the same action every day, the GUI should make that action fast. If one mistake can cost 10 minutes or $50, the interface needs stronger checks and clearer feedback than a casual dashboard does.
Which GUI Elements Matter Most?
A strong GUI uses the right parts for the task, not the flashiest parts, and that choice shapes how fast people finish work. In a 2026 system analysis and design course, students often learn this by comparing a 3-step form with a 9-step form and seeing which one users finish faster.
- Windows hold the main workspace. They should keep related tasks together so users do not jump across 4 screens for one job.
- Menus group actions in a predictable place. A clear menu cuts search time, while a messy one makes even simple tasks feel like a scavenger hunt.
- Icons save space, but they need labels when the meaning is not obvious. A tiny trash can icon works in one app and confuses users in another.
- Buttons drive action. “Save,” “Submit,” and “Cancel” should look different enough that users do not click the wrong one at 2 a.m.
- Forms collect data one field at a time. Good forms keep required fields short and ask only for what the system truly needs.
- Navigation shows where users are and what comes next. Breadcrumbs, tabs, and sidebars help when a task has 5 or more steps.
- Feedback messages tell users what happened. A clear success note, warning, or error message beats silence every time.
- Input controls like dropdowns, radio buttons, and date pickers reduce bad entries. They matter most when the system needs exact values, not guesswork.
Why Do GUI Usability Principles Matter?
Usability principles make a GUI easier to learn, faster to use, and harder to break, which is why teams treat them as design rules, not style advice. Consistency, clarity, learnability, feedback, error prevention, accessibility, and efficiency all work together, and a system that ignores even 1 or 2 of them tends to feel rough fast.
What this means: If one button says “Save” on screen 1 and “Finish” on screen 2, users waste time and hesitate. If every form uses the same label style, the same color cues, and the same layout pattern, people build habits in minutes instead of days. That is not fancy. It is just smart design.
Accessibility matters just as much. A screen with tiny text, weak color contrast, or no keyboard support blocks real users, including people on small phones, older laptops, and screen readers. In the United States, WCAG 2.2 gives designers a clear target, and even a basic 4.5:1 contrast check can catch obvious problems before launch.
Good feedback also saves time. A message that says “Password must have 8 characters” helps more than a red box with no explanation. My take: many teams overwork the visual polish and underwork the feedback loop, and users pay for that choice on day 1.
Learn Systems Analysis Design Online for College Credit
This is one topic inside the full Systems Analysis Design course on UPI Study — a self-paced, online class that earns real college credit. Credits are ACE and NCCRS evaluated and transfer to partner colleges across the US and Canada. Courses start at $250 with no deadlines and lifetime access.
See Systems Design Course →How Do Requirements Become GUI Screens?
Turning requirements into screens starts with facts from users, not guesses from designers. In a solid system analysis and design process, teams move from task lists to wireframes, then to flows, then to prototypes that real users can react to in 15 minutes or less.
- Gather user requirements first. Ask what users do, how often they do it, and which 3 tasks matter most, because the screen should follow the work, not the other way around.
- Sketch wireframes next. These rough layouts show placement, size, and sequence without wasting time on color, and teams can review them in 1 meeting instead of 3 rounds of mockup edits.
- Define screen flows after that. Map each step from login to completion so users do not hit dead ends or repeat a field they already entered.
- Build a prototype and test it with users. A 20-minute test can reveal broken labels, awkward tab order, or a missing back button long before launch.
- Refine the design based on feedback. If 5 out of 8 testers miss the same button, move it now, not after release.
Worth knowing: Good analysis writes the GUI before code hardens the bad choices. That saves rework, and rework costs real time when a team has a 6-week build window or a fixed release date.
What Makes a GUI Effective or Frustrating?
An effective GUI helps users finish tasks in a straight line, while a frustrating one makes them stop, reread, and backtrack, sometimes 3 or 4 times in one session. The difference usually comes from small choices, not giant mistakes. A cluttered page, a vague label, or a broken error message can do more damage than a missing feature because users notice friction right away. That is why teams test flow, spacing, and wording before they freeze a design.
Reality check: A pretty screen with bad structure still feels bad. Users remember confusion faster than color.
- Cluttered screens bury the main task under too many boxes, and 10 extra items can feel like a wall.
- Unclear labels force guessing, which slows first-time users and creates avoidable errors.
- Inconsistent navigation makes users relearn the system on every page.
- Poor error handling leaves people stuck after one mistake, which is a terrible trade.
- Ignoring mobile or accessibility needs cuts off users on 6-inch screens and assistive tech.
How Do GUIs Fit in System Analysis and Design?
GUIs sit inside system analysis and design as a working part of the whole system, not as a separate art project. Analysts use them to confirm requirements, designers use them to shape workflow, and testers use them to spot gaps before launch. That link matters in real projects because a screen often reveals whether a rule is missing, a step is redundant, or a form asks for the wrong data.
Students see this clearly in a system analysis and design course or an online course where they build graphical interfaces GUIs in small projects and compare the results against task goals. A strong project can support transferable credit, college credit, or ACE NCCRS credit when the course path fits the school’s rules. The point is not just to make a neat mockup. The point is to show that the interface can carry the business process in a usable way.
Bottom line: GUI work sits at the center of analysis because every good screen proves the requirements make sense. If the workflow feels awkward in a prototype, the design probably needs another pass before anyone ships code.
Frequently Asked Questions about System Analysis Design
Start by mapping the user's task flow, then turn each step into a screen, button, field, or menu. GUIs in system analysis and design are the visual parts of a system that let you collect input and show output, like forms, icons, tabs, and dashboards.
The most common wrong assumption is that a GUI is just about making things look nice. In system analysis and design, a GUI has to match user goals, reduce clicks, and keep error rates low, or the screen may look good but work badly.
If you get it wrong, users slow down, make more mistakes, and drop tasks like sign-up or payment. A bad GUI can hide fields, overload one screen with 12+ choices, and force extra training, which hurts the whole system analysis and design course project.
Most students are surprised that building graphical interfaces GUIs starts with user rules, not colors or fonts. A strong screen often uses just 5 to 7 clear items, one primary button, and consistent labels so people can finish tasks in fewer steps.
This applies to analysts, designers, and students in a system analysis and design course, and it doesn't stop at programmers or visual designers alone. You also see it in business apps, school portals, and healthcare systems where users need fast, clear input.
Most students start with colors and layouts; what actually works is starting with user requirements, task frequency, and error points. You gather 3 to 5 core tasks, then design screens that support those tasks with labels, spacing, and feedback.
A weak GUI can waste 10 to 30 extra seconds per task, and that adds up fast across 50 or 500 users. If a form has 8 fields with vague labels, people pause, guess, and backtrack far more often.
No, GUIs in system analysis and design are not only about visuals; they also shape usability, data entry, and error handling. The caveat is that a clean screen still fails if the workflow forces users through extra steps or unclear choices.
You turn user requirements into a GUI by converting tasks into screens, fields, and actions, then testing whether users can finish them in 3 to 5 steps. A login, search, or checkout flow should match the real order people use.
You should know text fields, buttons, menus, checkboxes, radio buttons, icons, tabs, and alerts. These elements handle 2 basic jobs: taking input and giving feedback, and your course work usually tests whether you can place them in the right spots.
Yes, an online course can give you college credit or transferable credit when it carries ACE NCCRS credit through a cooperating school. UPI Study credits are accepted at cooperating universities worldwide, and that matters if you study online and want formal recognition.
You should look for a course that names ACE or NCCRS approval, lists the credit value, and shows a clear assessment plan. That helps when you want college credit from a system analysis and design course, because the school can match the work to its policies.
Final Thoughts on System Analysis Design
GUIs matter in system analysis and design because they turn abstract requirements into something people can touch, test, and judge in seconds. A good interface does not just look neat. It matches the task, cuts confusion, and helps users move through a system without extra friction. The strongest GUI work starts early, right when the team gathers requirements and maps the first workflow. That is where screen order, field count, labels, error messages, and navigation choices should come from. Miss that stage, and the team ends up fixing the same problem in design, code, and testing. Hit it early, and the rest of the build gets cleaner. The common mistake is still the same one: treating the GUI as the final coat of paint. That mindset causes bloated screens, weak feedback, and clumsy navigation. A better mindset treats each screen like part of the system’s logic, because that is what it really is. If you are studying this topic, keep asking one blunt question about every screen: does this help the user finish the task in fewer steps? That question cuts through noise fast, and it points you toward better design choices right away.
How UPI Study credits actually work
Ready to Earn College Credit?
ACE & NCCRS approved · Self-paced · Transfer to colleges · $250/course or $99/month